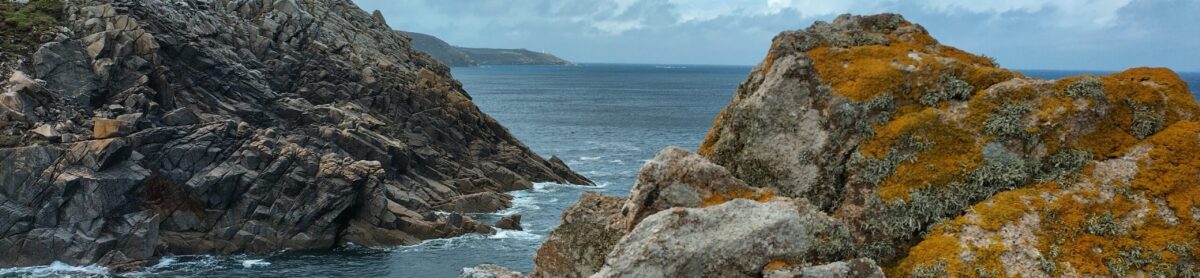
It’s Christmas, and I’ve been visiting my Mum in the village I grew up in. There’s a ‘new’ housing estate up the road – I say new, it was built over thirty years ago – with a wall at the entrance that’s got a really solid population of a crustose lichen called Ochrolechia parella (Fig.1). I’ve always quite liked this species, it’s fairly easy to recognise and a familiar sight when I’m out climbing on sea cliffs. While Christmas lunch was cooking, I thought I’d take the opportunity to try out a bit of lichenometry.

Lichenometry is the technique of using lichen growth rates as a way of measuring time. Lichens, as you may know, grow slowly. There’s a bunch of reasons for this (as well as a lot of exceptions) that I won’t go into here, but generally if you’re looking at a crustose lichen on a bit of rock you can assume it’s been there for a fairly long time. How long? The easiest way to get an idea of this is to go to a churchyard and look at gravestones. Older gravestones have more lichens on them. A few of those lichens might be pretty big and assuming that they’ve been there the longest we can get a good idea of their age by looking at the date on the stone, and from this you can work out their growth rate. This is the essence of lichenometry. It’s a technique that’s found a home in geography, particularly in dating the exposure of glacial moraine; if you have an estimated growth rate for a particular lichen that appears on the rocks of the moraine (geographers typically use Rhizocarpon geographicum, the map lichen) then you can have a stab at the date that those rocks were first revealed, giving you a picture of the dynamics of the glacier that deposited them. Neat.
Cool as this is, trying to work out dates from a single population of lichens is kind of impossible. In an uncomplicated world, a rock would be colonised by the first fungal spores on the day it was first exposed to the environment. All would germinate simultaneously and the lichens would grow at identical rates. No more lichens would establish themselves after that first cohort and nothing would interrupt their expansion. Every lichen would be a perfect circle and determining the age of that initial exposure would be straightforward.
This is of course wishful thinking (thankfully so – a world built on such simple rules would be missing all of the complexity that makes geography, ecology, and evolution such fascinating fields of study) and there are a bunch of things to confuse the situation. There was probably a lag prior to lichens getting established and while some individuals might have got off to an early start, others may have taken their time. Opportunities for colonisation don’t stop after the arrival of the first pioneers, and colonisation rates might increase once the first lichens reach maturity and start reproducing themselves locally. Once they’re established lichens might encounter environmental barriers, mosses, other lichens of both the same and different species, and the developing shapes of lichens are highly heterogeneous. With so much noise inherent in the technique, proper lichenometry studies use 1,000+ samples from multiple locations to calibrate measurements, and even then its been called into question how accurate they can actually be (Winchester, 2023).
But just because things aren’t perfect doesn’t mean that we shouldn’t see what we can find out, and I’ve always been a firm believer that useful insight can be obtained from even the crappiest of data. With that in mind, I went to measure some lichens. There’s not a lot in the way of moraine in Hampshire, but there is that wall at the edge of the housing estate.
My methods were simple:
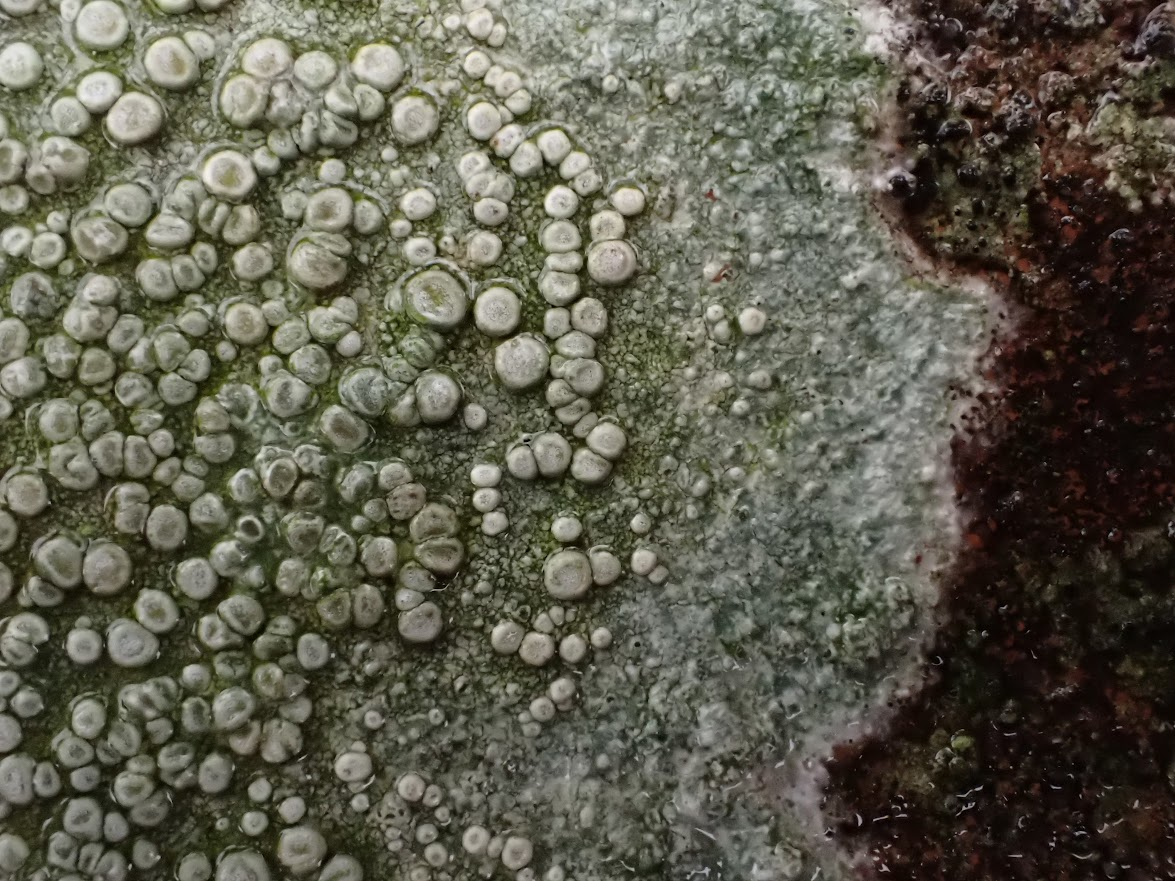
- Measure the diameter of O. parella thalli (plural of thallus, the word we use to refer to the body of a lichen) on the top of a waist-height brick wall in the south of England (Fig. 2).
- When large thalli were clearly confluent (multiple lichens joined together), each part was measured as a separate thallus.
- Only lichens that were easily identifiable as O. parella due to the presence of thick-rimmed apothecia (fruiting bodies) were counted.
- Growth rates were calculated as the radius (i.e. half the diameter) in mm divided by the approximate length of time the wall had been standing (32 years) to give a growth rate in mm per year.
- Eat Christmas lunch.

After filling up on cheese and mince pies I imported the measurements for 84 thalli into R and did some basic analysis. Lets pretend for a second that we live in that fantasy world where everything landed on the wall at the same time. Based on the size of the thalli and a known elapsed time of 32 years, if everything that’s there now had started growing simultaneously then we’d be looking at growth rates of O. parella ranging from 0.6 mm per year for the smallest thalli to 2.3 mm per year for the largest thalli (Fig. 3).
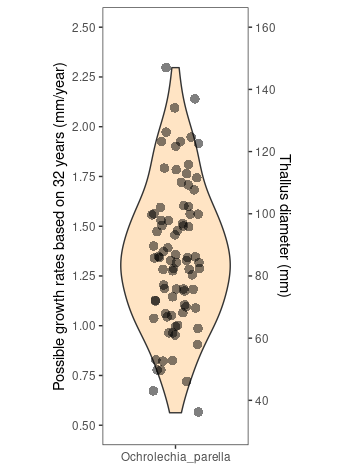
There are a couple of things to note here. First of all, this would mean the biggest thalli were growing four times faster than the smallest thalli. Is it likely that there’s this much variation in growth rate between individuals of the same species, in the same habitat? I guess it’s possible but I’d be inclined to think that this is probably supporting colonisation as a continuous process, with the smaller lichens having started growing later. Using the predicted growth rate of the biggest (and supposedly oldest) lichens of 2.3 mm per year, we can work out that an O. parella thallus 40 mm across might have been growing for somewhere between 8.5 and 9 years. This leads onto my second point; although these rates are slow I don’t think they’re CRAZY slow. Some lichens like R. geographicum, have average growth rates around 0.6 mm per year and as slow as 0.1mm per year in montane environments (Bradwell and Armstrong, 2007), so these measurements suggest O. parella is relatively rapid grower in the crusty lichen world. This fits with its habitat – rather than the extremely nutrient poor and snow covered environment of the mountains, the temperate south of England is much more favourable to faster rates of growth.
That’s not all we can learn from the frequency/size relationships of these lichens. Most thalli I measured were of a middling size; there were few very big lichens but also few small lichens. This is a bit different from most of the more thorough lichenometry studies that I’ve looked at, which tend to show a mean thallus diameter towards the smaller end of the spectrum. Have a look at these from lichens on bridges in Glen Coe (Fig. 4).

See how the graphs tend to lean to the left (counterintuitively we call this ‘right skewed’ data because most of the tail of the distribution is on the right)? I think this makes sense; you’re not going to end up with high numbers of very big individual lichens – there’s just not enough space – whereas you can pack quite a lot of small lichens into the same area. At early stages of colonisation the ‘elders’ of the lichen pack have little in the way of competition and are free to get big. Further down the line though, as more and more lichens get established and competition for space grows, individuals become restricted in how big they can get and the graph becomes biased towards higher frequencies of small thalli. So where are all the small thalli in my study? And why are there no lichens less than 30mm across (Fig. 5)?
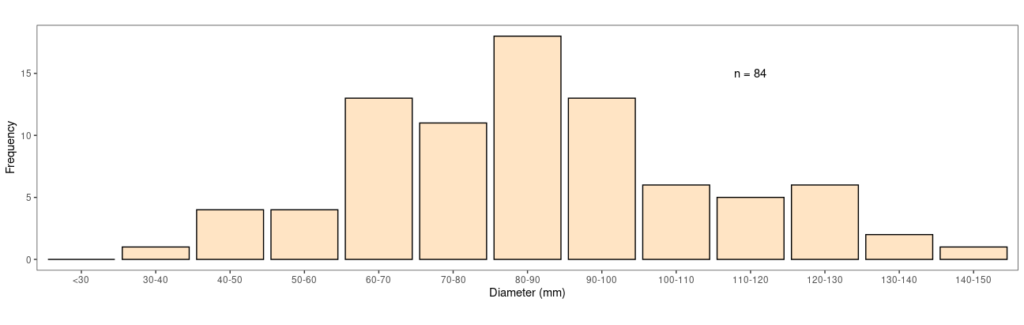
One possibility is that the whole lichen community on the wall isn’t yet fully developed and that in time more smaller thalli will appear. This fits with the theory but still doesn’t explain the total absence of very small thalli, and I reckon there are some demographic factors that I haven’t taken into account. If you remember, I restricted my sampling to thalli with obvious fruiting bodies, ignoring anything that was infertile. There were lots of smaller white crusts and I have a suspicion that they are young O. parella thalli and it’s these that are missing from my distribution, which leads to one more piece of insight. Based on our calculations above, and assuming that our hypothesis is correct and the smallest thalli are infertile, we can work out that on this little wall O. parella is taking about 6.5 years to reach maturity. This is all quite speculative of course but not bad for twenty minutes staring at a wall on Christmas Day.
- Bradwell T, Armstrong RA. 2007. Growth rates of Rhizocarpon geographicum lichens: a review with new data from Iceland. Journal of Quaternary Science 22: 311–320.
- Innes JL. 1983. Size Frequency Distributions as A Lichenometric Technique: An Assessment. Arctic and Alpine Research 15: 285–294.
- Winchester V. 2023. Lichenometric Dating and Its Limitations and Problems: A Guide for Practitioners. Land 12: 611.
This makes for interesting and easy reading Nathan and has set me after you once more for an ideal Bulletin article!
Love the way you have come up with valuable observations even though we cannot presume that all the thalli began to grow at the point when the wall was built. A consideration which would have perplexed me. Great stuff.